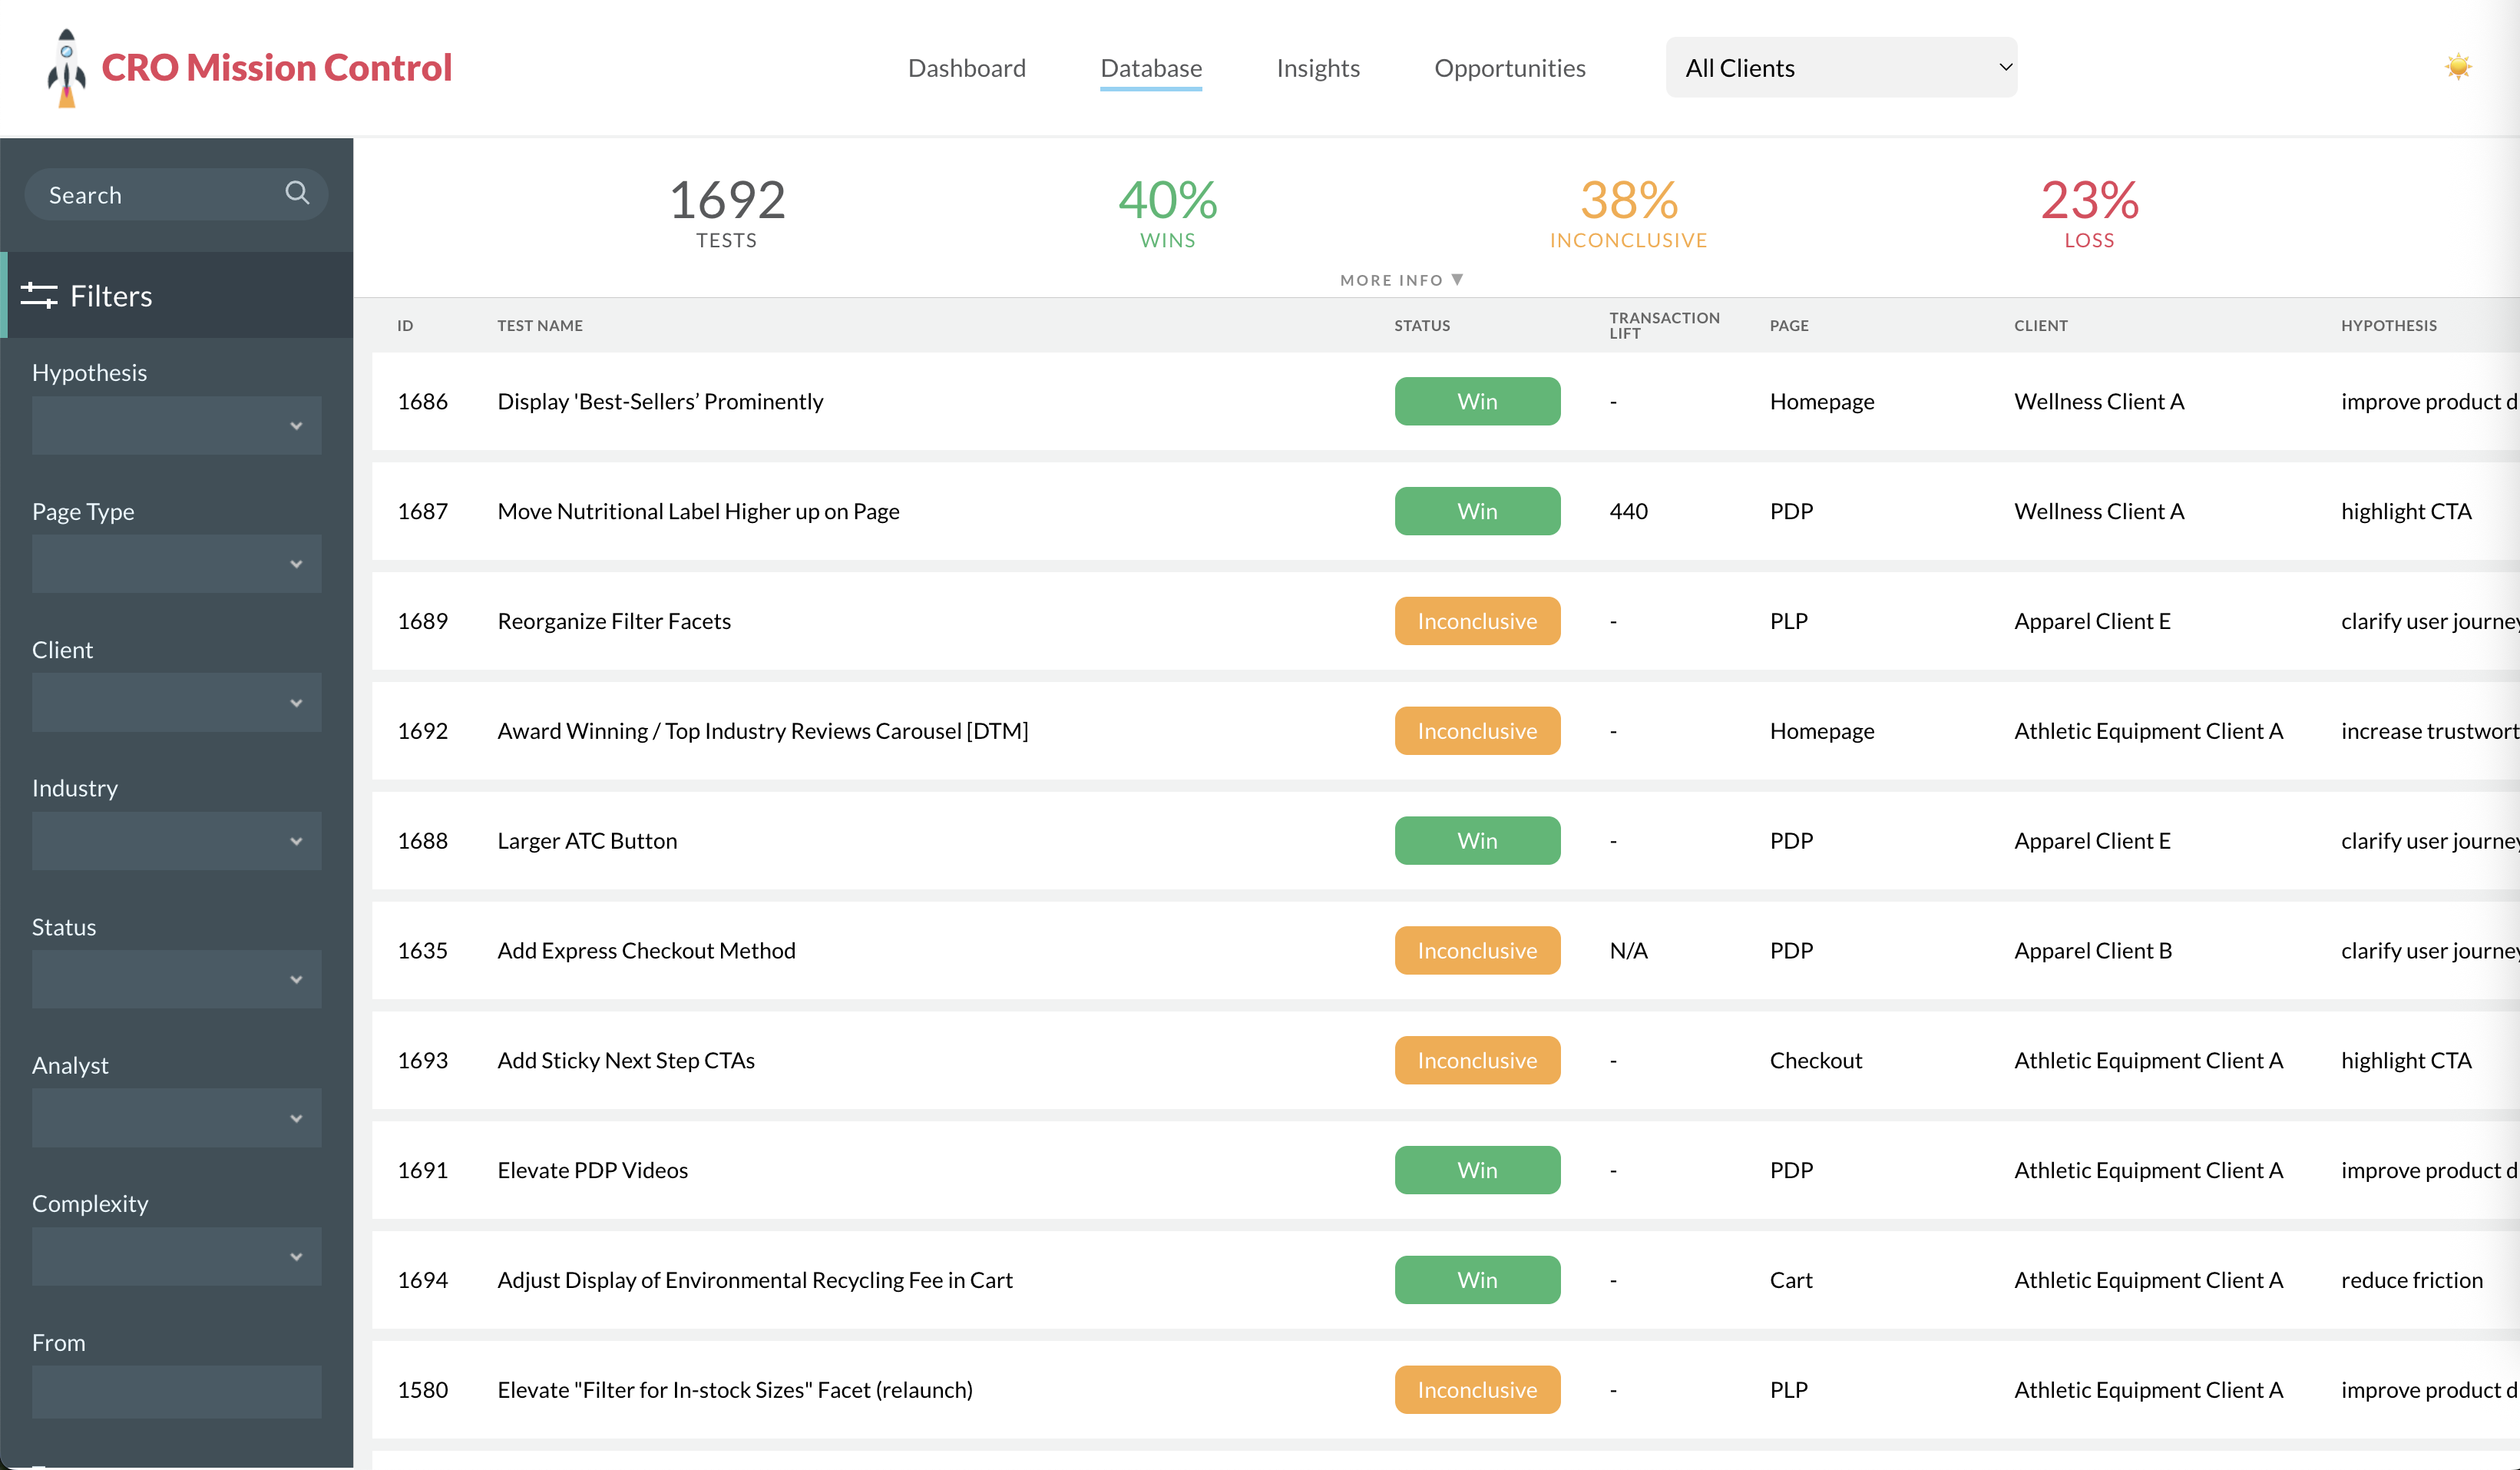
- Centralize the Conversion Optimization team's bank of A/B test results.
- Make past learnings discoverable with sorting, searching, and filtering functions.
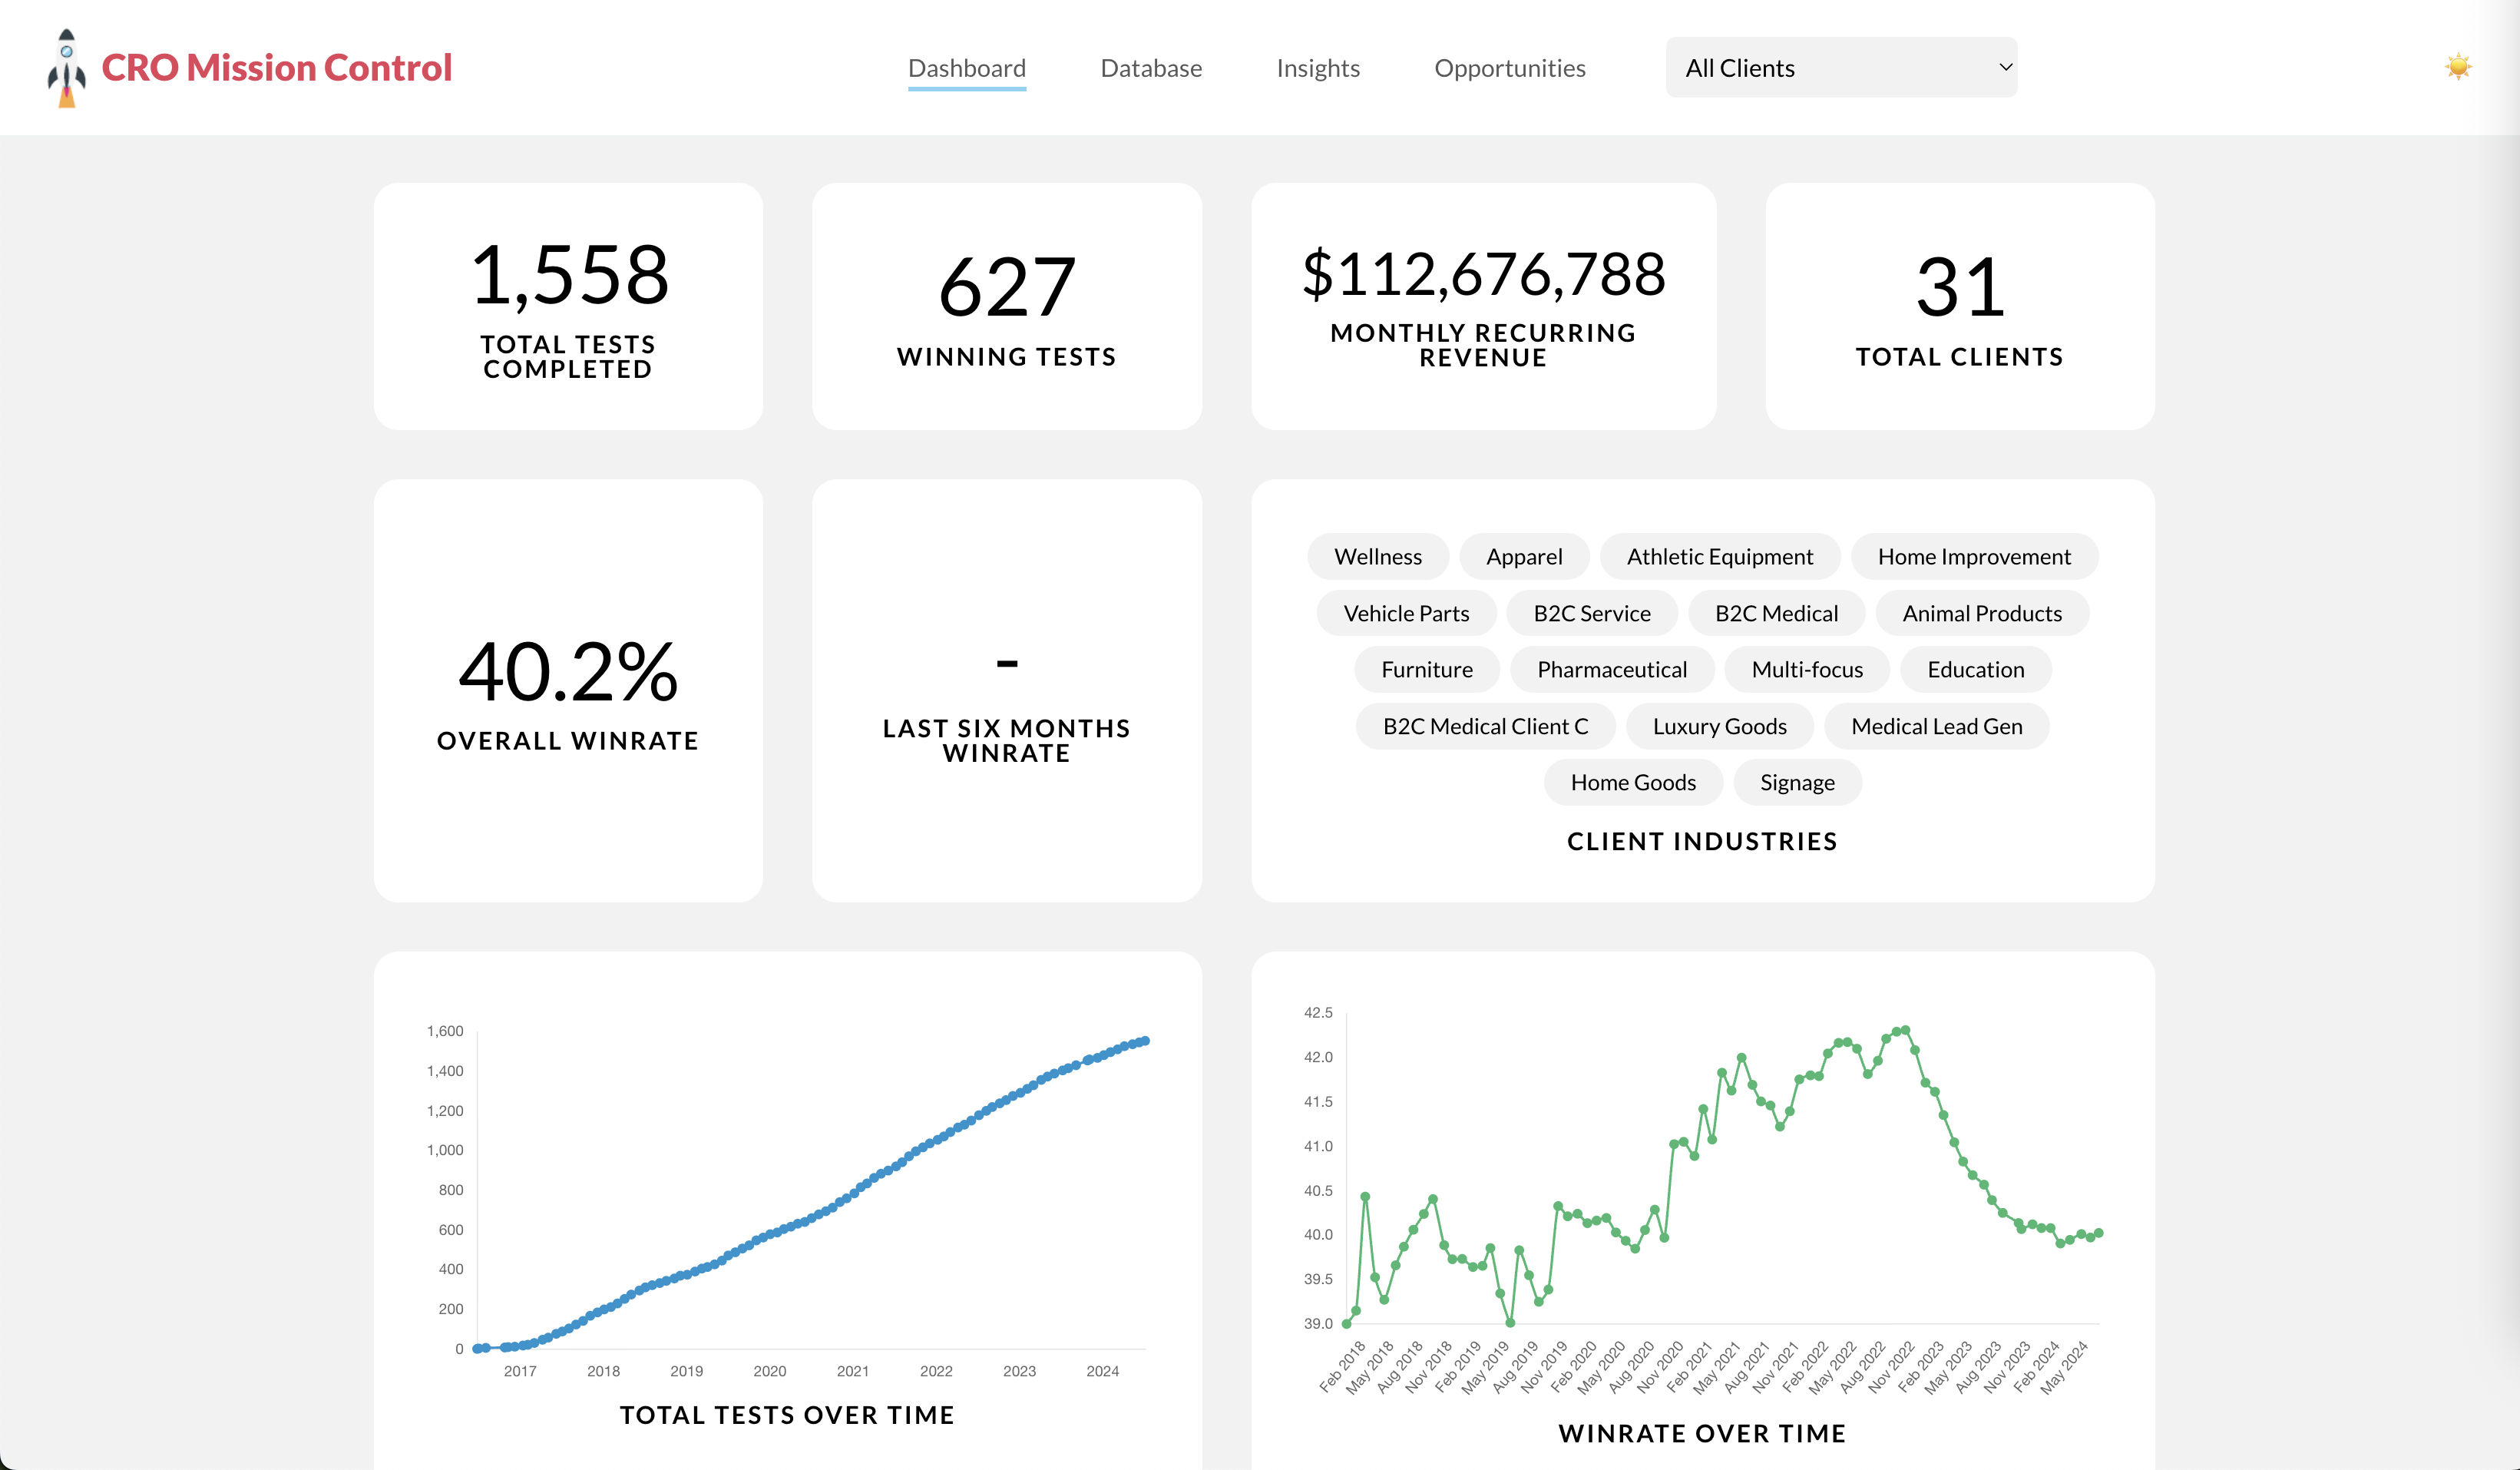
- Aggregate data to display key metrics across all clients.
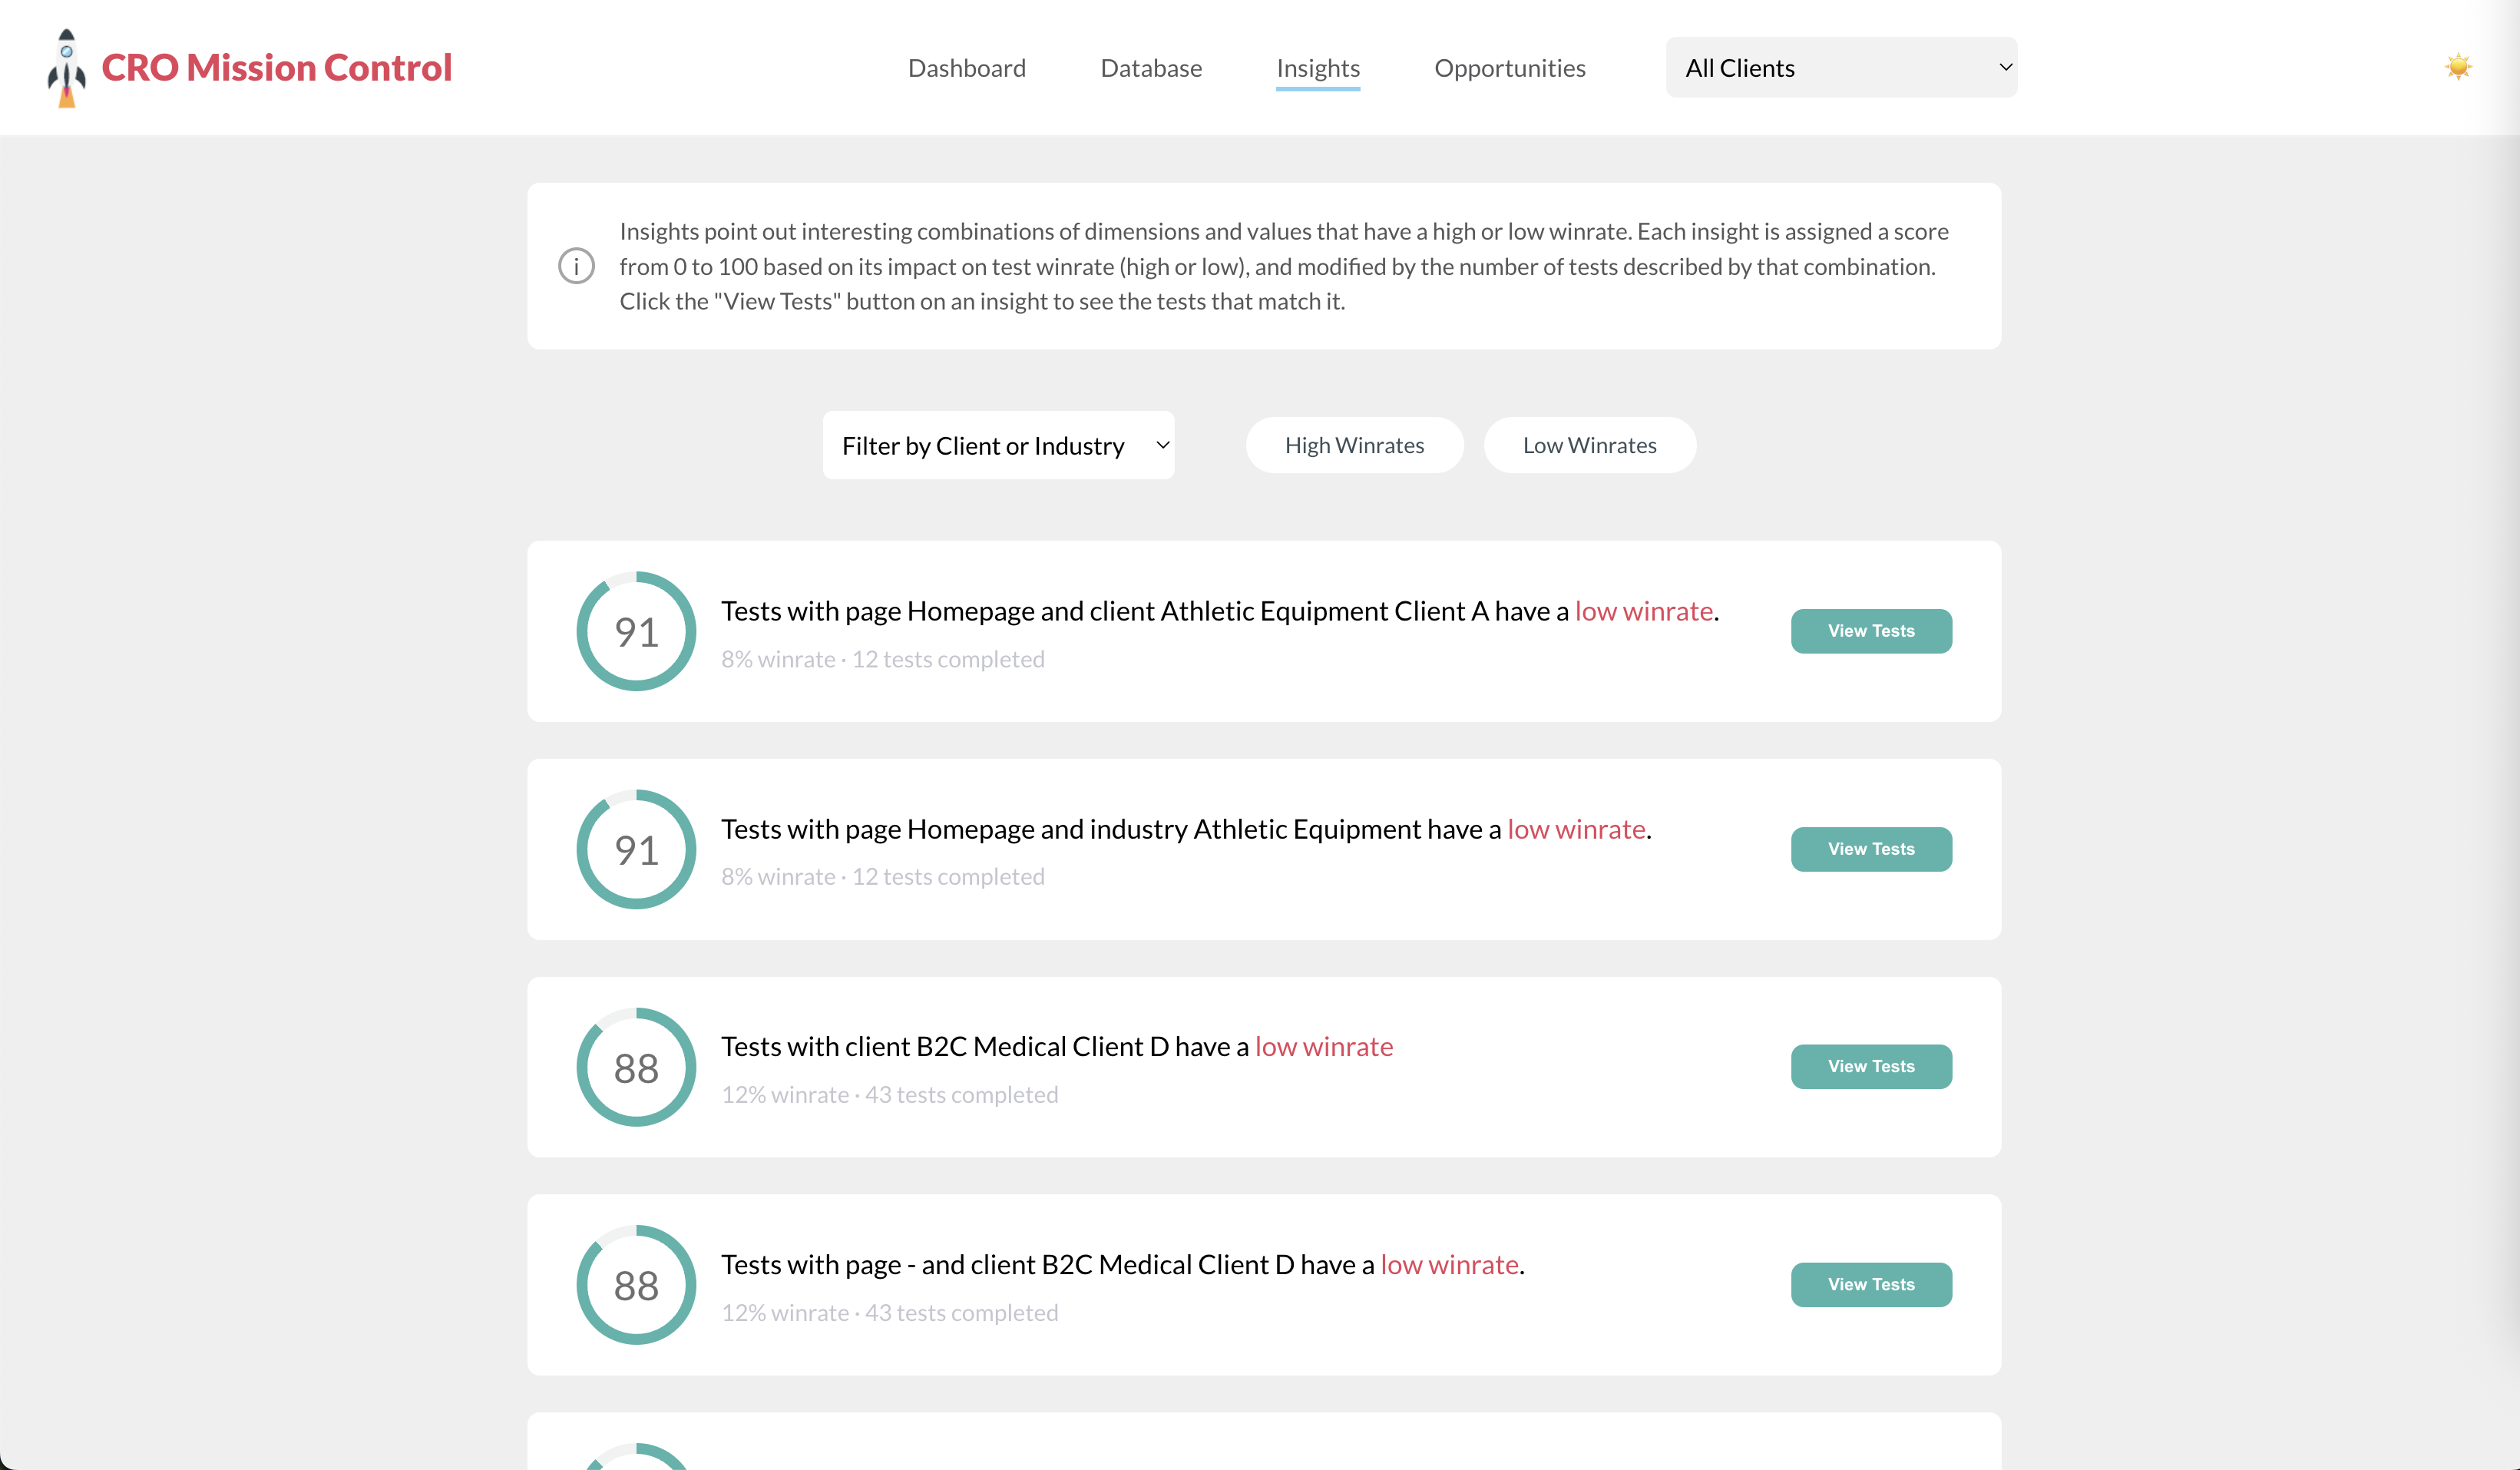
- Surface trends and insights based on testing history.
For years, the Conversion Optimization team at my previous company had stored historical test data in scattered, unwieldy spreadsheets within Google Drive. To capitalize on the team's vast institutional knowledge, I engineered a React application to consolidate and display this data in a single, user-friendly interface. The initial "database" view displayed all test records in rows, with robust search and filter tools enabling analysts to quickly surface relevant results from past experiments.
With the data centralized, I expanded the application to support deeper analysis. I implemented a "dashboard" view containing dozens of widgets that showcased consolidated metrics from the team's testing history. These included high-level statistics, such as total tests run and client count, alongside dynamically generated charts illustrating win rates over time and across page types.
To extract further value, I designed custom algorithms to uncover actionable insights, spotlighting recurring patterns across hypotheses, page types, and client industries that correlated with consistently high or low win rates. Each insight was paired with a confidence score, allowing analysts to quickly gauge its reliability and potential impact.
The CRO Database transformed how the team accessed and leveraged historical testing knowledge. Instead of digging through scattered spreadsheets, analysts now had a single source of truth with powerful search, filtering, and visualization capabilities.
The centralized view accelerated the test ideation process, making it easier to uncover past learnings, avoid repeating failed experiments, and identify proven strategies worth expanding. Analysts incorporated the surfaced insights directly into their proposals, using historical evidence to build stronger cases for new tests with clients.